A VPN usually adds some network overhead, but there is no universal slowdown percentage. We reviewed five public speed-test datasets to examine how much the result changes with route distance, protocol, baseline speed, and test design.
Yes, a VPN can slow an internet connection because traffic is encrypted and routed through another server. But one percentage cannot describe every connection. Across the public datasets we reviewed, results changed with server distance, protocol, baseline bandwidth, device, and measurement method. A result from one route or publisher should not be treated as a prediction for every user.
Publisher disclosure: This report was produced by BearVPN, a VPN provider. BearVPN was not included in the eight-service sample. We reviewed public third-party speed-test data and did not reproduce the tests. The report compares methods and observed results; it does not rank the products or assess their overall quality.
Key Findings
- Route distance made a large difference within one test system. In Private Proxy Guide’s Sweden-origin dataset, the median result across eight VPNs was 95.08% retention on nearby routes, 80.08% to the United Kingdom, and 17.40% on routes to the U.S. East Coast and Singapore.
- Brand results were much closer under one standardized setup. In Security.org’s New York-to-Australia OpenVPN test, the eight observed results ranged from 91.82% to 96.10%, a spread of 4.28 percentage points.
- No single cross-publisher retention value emerged for any sampled VPN. The range between each VPN’s lowest and highest source-specific summary was 15.98 to 52.02 percentage points, reflecting differences in source methods and route sets.
- One route result exceeded its baseline. A 103.17% observation in the Reviews Ally data shows why a result above 100% should be treated as network variation or a routing effect—not proof that a VPN will reliably accelerate a connection.
These percentages are not pooled into an overall brand score. Each source used its own routes, protocols, baselines, hardware, test period, and aggregation method.
What Does “VPN Speed Loss” Mean?
VPN speed claims usually refer to one of three related measurements:
- Baseline speed is the download speed measured without the VPN.
- VPN speed is the download speed measured while connected to the VPN.
- Speed retention is the VPN speed divided by the baseline speed, expressed as a percentage.
The basic calculation is:
speed retention = VPN download speed ÷ baseline download speed × 100
Speed loss is the other side of the same calculation:
speed loss = 100% − speed retention
If a connection measures 100 Mbps without a VPN and 85 Mbps with a VPN, it retains 85% of the baseline speed and loses 15%. But that percentage does not tell the whole story. An 85% result means 85 Mbps on a 100 Mbps connection and 850 Mbps on a 1 Gbps connection. The percentage describes relative overhead; Mbps describes the throughput available for actual use.
That is why absolute Mbps and retention percentages should not be mixed without context. A service can post a high absolute speed on a very fast test line while losing a large share of the baseline. Another can retain most of a slower connection while producing a lower Mbps result.
The extra route and encryption work are part of how VPN encryption and routing change the connection path, but they are not the only variables that affect a speed test.
Why Can a VPN Slow Down Your Internet?
A VPN changes the path between a device and its destination. Several parts of that path can affect speed.
Encryption and decryption
The VPN app encrypts outgoing traffic and decrypts incoming traffic. Modern devices and protocols can perform this work quickly, but it is still additional processing. Older phones, low-powered routers, and busy devices may reach their processing limit before the internet connection reaches its advertised speed.
The extra route through a VPN server
Without a VPN, traffic follows the route chosen by the internet service provider and upstream networks. With a VPN, it first travels to a VPN server and then continues to the destination. A well-connected nearby server may add little distance. A remote server can add several network segments and more opportunities for congestion.
Server location and network peering
Physical distance matters, but route quality also matters. Two servers in the same country can use different carriers or peering arrangements. The geographically closest server is not always the route with the fewest delays or the most available capacity.
Server load
A busy VPN server may have less capacity available per user. Load also changes over time, so two tests against the same location can produce different results.
Protocol choice
WireGuard-based protocols, OpenVPN, IKEv2, and provider-specific protocols do not have identical overhead or implementations. A result collected with OpenVPN should not be treated as directly equivalent to one collected with WireGuard or a proprietary protocol.
The device and local network
Wi-Fi conditions, router performance, operating-system networking, background traffic, and the speed-test server can all affect the result. A VPN test can therefore reflect more than the VPN alone.
Baseline bandwidth
A high-speed test line may expose an app, protocol, CPU, or server throughput limit that is invisible on a slower home connection. Conversely, a 100 Mbps baseline can make several VPNs look similar because the test never approaches the products’ maximum throughput. The percentage loss and the user’s practical experience are related, but they are not interchangeable.
How We Reviewed Five Public VPN Speed-Test Datasets
We reviewed publicly accessible speed data for eight VPN services: NordVPN, Surfshark, ExpressVPN, Proton VPN, Private Internet Access, CyberGhost, IPVanish, and PureVPN.
These eight formed the core sample because each appeared in at least three eligible sources. Not every source covered every product. Products with less coverage were not added merely to make the sample larger.
Included sources
The linked pages may update after our review date. Our calculations refer to the snapshots and test periods shown above.
To enter the main evidence table, a source needed a public methodology and either a paired VPN-off baseline or a directly reported retention or loss percentage. The result also had to be traceable by provider and route or region. We did not calculate retention from a site’s advertised test-line capacity when no paired baseline was published.
We treated multiple pages from one publisher as one source, not independent confirmation. For Cybernews, we used the four regional retention rows rather than the page’s narrative or composite average because the regional values could be traced consistently across the five included providers. For Comparitech, we used the August 2026 regional table because it exposed region-level values and sample counts. Its later live platform was used as a methodology cross-check, not counted as another publisher.
How we summarized the data
Within Cybernews, Comparitech, Reviews Ally, and Private Proxy Guide, we took the median of a provider’s eligible route or regional retention values to create a source-specific summary. Security.org provided one standardized route per provider, so the route result itself served as that source’s value.
We did not average those source-specific summaries into an overall provider score. Doing so would combine different routes, protocols, baseline speeds, devices, test dates, and route weights. It would create a precise-looking number without a common experimental meaning.
For Reviews Ally, we reproduced the method from its downloadable CSV: we calculated each provider’s mean baseline download speed, grouped repeated standard-route rows by server location and mode, and divided the route mean by the provider baseline. Protocol-comparison rows were not included in that calculation.
Values above 100% were retained rather than capped. They are useful warnings about network variation, but they were not treated as evidence that a provider reliably increases speed.
Commercial context and conflicts
The five sources are commercial review or industry-content publishers, not academic laboratories. Their sites may earn money through affiliate links. Comparitech describes its affiliate-funded editorial model and states that Point Wild also owns several VPN products. In October 2026, Comparitech said it stopped publicly scoring or listing its parent-owned VPN products on its live VPN Intelligence Platform. Hotspot Shield and Total VPN were not part of our core sample.
Commercial relationships do not automatically invalidate a measurement. They do mean that readers should examine the method, raw fields, disclosure, and reproducibility rather than relying on a ranking label alone.
Finding 1: Route Groups Differed by 77.68 Percentage Points Within One Dataset
Private Proxy Guide published route-level retention results for all eight VPNs in our core sample. Its tests originated in Sweden, which made it possible to examine nearby, medium-distance, and longer-distance destinations within one published system.
For the nearby group, we first took each provider’s median across Sweden and Germany, then took the median across the eight providers. We followed the same provider-first approach for US East and Singapore. The United Kingdom had one route value per provider.
The gap between the nearby and long-distance summaries was 77.68 percentage points. That gap is much larger than the brand spread observed under Security.org’s single standardized setup, discussed below.
The comparison is useful because the route groups come from one publisher’s test framework. It does not establish that long-distance VPN connections generally retain only 17.40% of baseline speed. The number belongs to Private Proxy Guide’s origin, destinations, baseline, test period, and infrastructure. A test from another country or network can produce a very different result.
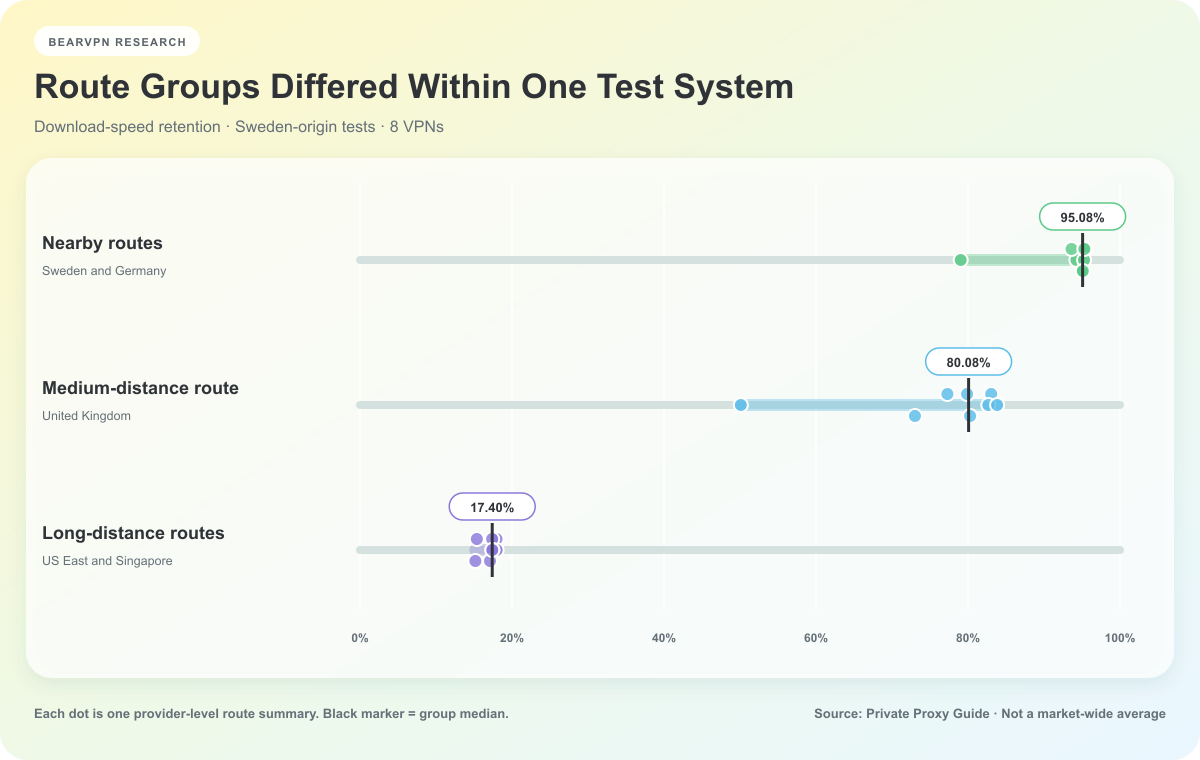
Each dot represents one provider-level route summary. The black marker shows the group median. Source: Private Proxy Guide. Results apply to this source’s Sweden-origin routes and method.
Finding 2: Under One Standardized Setup, the Eight VPN Results Were Close
Security.org tested all eight sampled VPNs under one reported setup: Windows 10, Ethernet, an approximately 100 Mbps fiber connection, OpenVPN, and a New York-to-Australia route. It reported a paired baseline and VPN download speed for each product, with 10 tests per VPN.
After recalculating retention from those published speeds, the eight results ranged from 91.82% to 96.10%. The median was 94.46%, and the total spread was 4.28 percentage points.
This does not mean those providers are always within four points of one another. It means they were close in this particular test. The 100 Mbps baseline may also have limited how much separation could appear between products capable of higher absolute throughput.
The more defensible conclusion is about comparison design: when the platform, protocol, baseline, route, and test count were held constant by one publisher, the observed brand spread was small. When route distance changed sharply within Private Proxy Guide’s system, the route-group difference was much larger.
Small differences should not be converted into a winner. A one- or two-point lead can reflect ordinary variation, and this dataset does not provide a common uncertainty interval for ranking those differences.
Finding 3: Source-Specific Results Differed for the Same VPN
For each VPN, we compared the lowest and highest source-specific summary available from the eligible publishers. This is a disagreement table, not a speed ranking. Each endpoint comes from a different source method.
The range does not measure product reliability. Private Proxy Guide’s source-specific summary, for example, is the median of five routes that include Sweden, Germany, the United Kingdom, the U.S. East Coast, and Singapore. Reviews Ally used a different set of routes from a consumer connection in Latin America. Cybernews and Comparitech used their own regional structures, while Security.org used one New York-to-Australia OpenVPN route.
Different protocols also contributed to the mismatch. Cybernews reported results using NordLynx, WireGuard, or Lightway depending on the provider. Security.org used OpenVPN. A difference between those sources therefore cannot be assigned to the VPN brand alone.
The useful finding is not that one brand reached the highest maximum or the lowest minimum. It is that none of the sampled products had one method-independent retention number. Even the smallest cross-source range was nearly 16 percentage points.
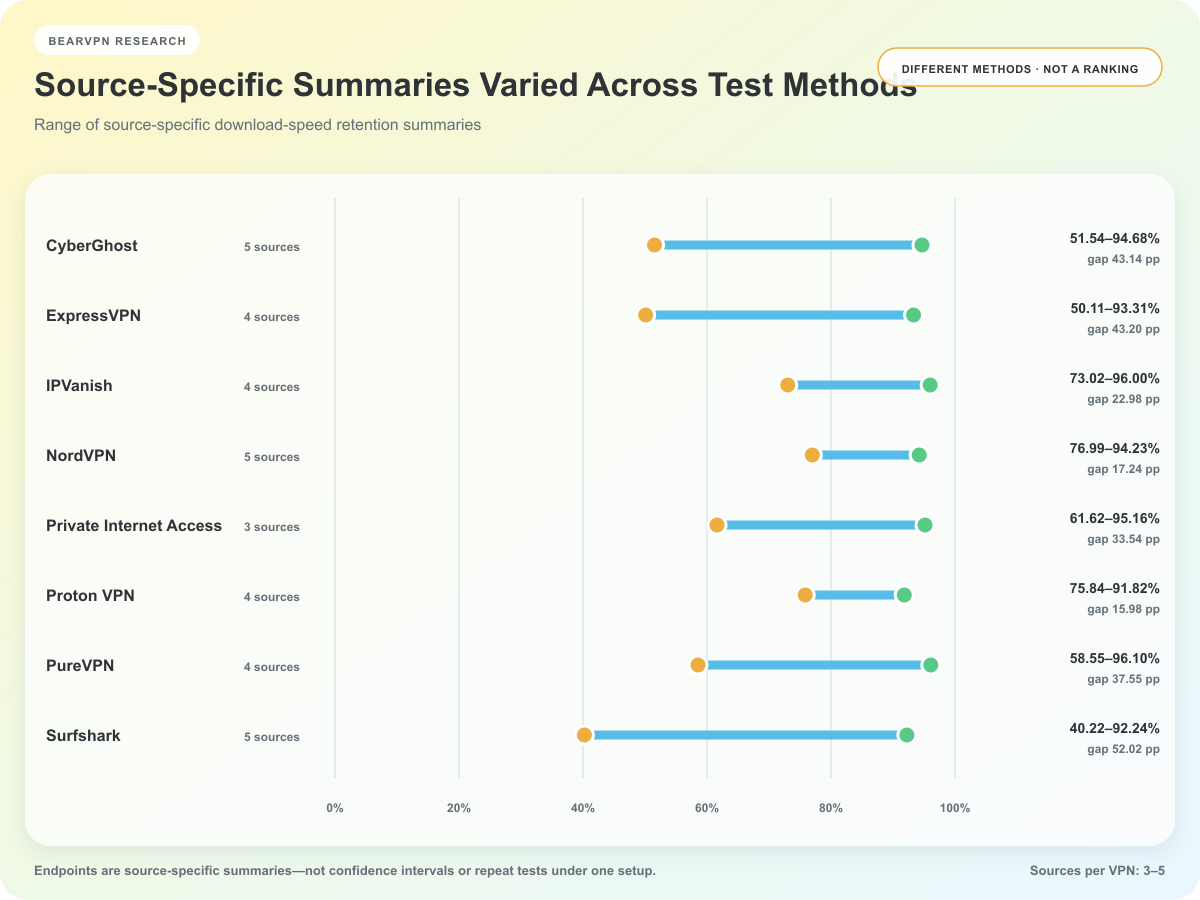
Range endpoints are source-specific summaries from different methods, not confidence intervals or repeated measurements under one setup. This is not a speed ranking.
Finding 4: Headline Numbers Were Not Directly Comparable Across Sources
The source-level summaries also differed. The median of the available provider summaries was 94.46% in Security.org, 77.50% in Cybernews, 83.76% in Comparitech, and 60.08% in Reviews Ally.
Those values should not be arranged as a ranking of publishers or testing strictness. Security.org represented eight providers on one route. Cybernews represented five providers across four regions. Comparitech represented seven providers across three regional groups. Reviews Ally represented six providers across different route sets and a different baseline design.
Private Proxy Guide is even more illustrative when it is not compressed into one number. Its near, UK, and long-distance route groups produced markedly different summaries. A single combined median would hide the most important feature of that dataset: distance and route composition changed the answer.
This is why a statement such as “VPNs reduce speed by 20% on average” is incomplete unless the publisher defines the baseline, products, routes, protocols, repeat count, aggregation rule, and test period. The headline may be mathematically correct for one dataset and still be a poor forecast for an individual user.
Can a VPN Ever Make a Speed Test Faster?
Occasionally, a VPN-on result can exceed its VPN-off baseline. In the Reviews Ally CSV, PureVPN’s Miami standard-route mean worked out to 103.17% of its provider baseline.
That observation should not be presented as proof that a VPN reliably improves internet speed. Internet measurements are not collected in a perfectly static environment. Congestion may change between runs. The VPN may take a different route to the speed-test server. Wi-Fi conditions, background traffic, and the test endpoint can also move.
In some circumstances, a VPN route could avoid inefficient ISP routing or a specific form of traffic management. Demonstrating a repeatable improvement would still require paired tests over time, a consistent endpoint, and enough repeated runs to separate the effect from ordinary variation.
For this report, the value above 100% was retained as published and recalculated. It was not capped, rewarded, or generalized into a product claim.
How Much Will a VPN Slow Down Your Internet?
The public data cannot predict one fixed percentage for an individual connection. The most relevant result depends on the server location and task a person actually uses.
A simple personal comparison can be more informative than a general ranking:
- Use the same device, network, and speed-test service.
- Record at least three VPN-off baseline runs.
- Connect to the nearest suitable VPN server and run at least three tests.
- If a distant location matters, run at least three tests against that specific location separately.
- Keep the VPN protocol and speed-test endpoint consistent.
- Compare medians rather than selecting the single best run.
- Repeat the process at another time before drawing a conclusion.
This is not the method used to create this report; BearVPN did not reproduce the cited tests. It is a practical framework for readers who want to understand their own connection.
The metric should also match the task. Large downloads and high-resolution streaming depend heavily on sustained throughput. Gaming and live calls can be affected more by latency, jitter, and packet loss. A VPN can retain a high percentage of download speed while still adding noticeable latency to a distant game server.
How to Read a VPN Speed-Test Claim
Before comparing two headline results, check whether the measurements answer the same question.
1. Was there a paired baseline?
A baseline from the same general test period is more useful than the advertised capacity of the test line. Without a comparable VPN-off result, absolute Mbps does not show the percentage of speed retained.
2. What route was tested?
A nearest-server test and an intercontinental test should not be placed in the same average without clear weighting. Look for the origin, destination, and whether the server was selected automatically.
3. Which protocol was used?
OpenVPN, WireGuard, IKEv2, and provider-specific protocols can perform differently. A publisher should identify the protocol or explain how it selected one.
4. What device and network were used?
The operating system, CPU, router, Ethernet or Wi-Fi connection, and baseline bandwidth can all shape the result.
5. How many runs were performed?
One run is vulnerable to normal network variation. Repeated tests and a stated aggregation rule are more informative.
6. Is the figure a mean, median, best run, or composite?
These summaries answer different questions. A best run shows what happened once under favorable conditions. A median is less affected by an outlier. A multi-region composite depends on which locations were included and how they were weighted.
7. When was it tested, and how is the publisher funded?
VPN apps, protocols, servers, and networks change. A useful report gives a test date and explains relevant commercial relationships.

Comparable VPN speed claims should disclose the baseline, route, protocol, test device, repeat count, aggregation method, date, and commercial relationships.
Speed is only one part of a VPN comparison. Introductory and renewal VPN prices can also differ substantially, but a higher price does not by itself establish better performance.
Limitations
This report is a secondary review, not an independent speed experiment. BearVPN did not reproduce the tests, inspect the publishers’ raw network traffic, or verify every measurement on the original hardware.
The five sources are commercial publishers rather than academic laboratories. They may receive affiliate revenue, and one source has a disclosed parent-company relationship with VPN products outside our core sample. We included commercial context because it is relevant to interpretation, but we did not create a numerical bias score.
The sources used different dates, devices, operating systems, protocols, baseline bandwidth, server-selection rules, routes, and aggregation methods. Not every source covered all eight VPNs. A source-specific summary therefore describes that publisher’s sample and method, not an interchangeable measurement unit.
The review focuses on download-speed retention. It does not establish upload performance, latency, jitter, packet loss, connection reliability, privacy, security, or overall product quality. It also does not show how every current app version or server performs. VPN software and infrastructure can change after the review date.
Finally, medians reduce the influence of individual outliers but do not make non-equivalent tests equivalent. Our cross-source ranges are diagnostic: they show disagreement between methods, not uncertainty intervals or product-stability scores.
What the Evidence Supports
A VPN normally adds work and an extra network path, so some slowdown is possible. The evidence does not support one universal loss percentage.
Within one source, changing route distance produced a much larger difference than the brand spread observed under another source’s standardized setup. Source-specific summaries for the same VPN also differed when the routes, protocols, baselines, and test systems changed.
The most useful VPN speed report is therefore not necessarily the one with the largest number of decimal places. It is the one that makes the baseline, route, protocol, device, repeat count, aggregation rule, and test date clear enough to evaluate.
Performance also does not establish whether a free VPN is safe. Speed, data handling, app behavior, security controls, and business practices require separate evidence.
Frequently Asked Questions
A VPN normally adds encryption and an extra route, so some overhead is possible. The effect may be small or large depending on the server distance, protocol, device, local network, and baseline connection. A test can occasionally exceed its VPN-off baseline because of routing changes or ordinary variation, but that does not prove repeatable acceleration.
Common causes include a distant server, server congestion, an inefficient network route, protocol overhead, device limitations, weak Wi-Fi, or a very fast baseline connection that exposes a throughput ceiling. Testing a nearby server and a different supported protocol can help identify whether distance or protocol choice is contributing.
It can. Gaming is often more sensitive to latency, jitter, and packet loss than to maximum download throughput. This report analyzed download-speed retention, so its percentages should not be used as gaming-latency scores. A nearby VPN server may reduce the extra distance, but the actual route to the game server still matters.
It is possible for an individual test to run faster with a VPN, especially if the VPN changes an inefficient route or avoids a specific form of traffic management. One result above the baseline is not enough to show a stable improvement. Repeated paired tests are needed.
There is no universal threshold. A user with a fast baseline may have ample throughput after a noticeable percentage loss, while someone on a slower connection may feel a smaller absolute reduction. The acceptable result depends on the task and whether latency, upload speed, or reliability matters more than peak download Mbps.
Sources and Reproducibility
Evidence was last reviewed on October 27, 2026.
Source pages may change after the review date. The published evidence table should preserve the values and snapshot dates used for this analysis.
Primary data sources:
- Security.org: Fastest VPNs
- Cybernews: Fastest VPNs
- Comparitech: Fastest VPNs
- Reviews Ally: 2026 VPN speed-test CSV
- Private Proxy Guide: VPN testing results
For calculated rows, retention was derived only when the source provided a comparable baseline and VPN download result. Route or regional medians were calculated within each publisher before any cross-source range was described. Different publishers were never averaged into an overall provider score.
The downloadable coded evidence table contains the source, review date, VPN, metric scope, origin, destination, route class, protocol, platform, baseline, VPN download speed, retention percentage, sample count, notes, and source URL for 130 records.
If a source corrects or replaces its methodology or results, the evidence table and affected calculations should be updated before the article text is changed.